Basic Plotting#
The simplest plot available is a simple display of the contents of the problem and results blocks. This takes the following form:
figure(1); clf;
plotRefSLD(problem, results)
RAT.plotting.plot_ref_sld(problem, results)
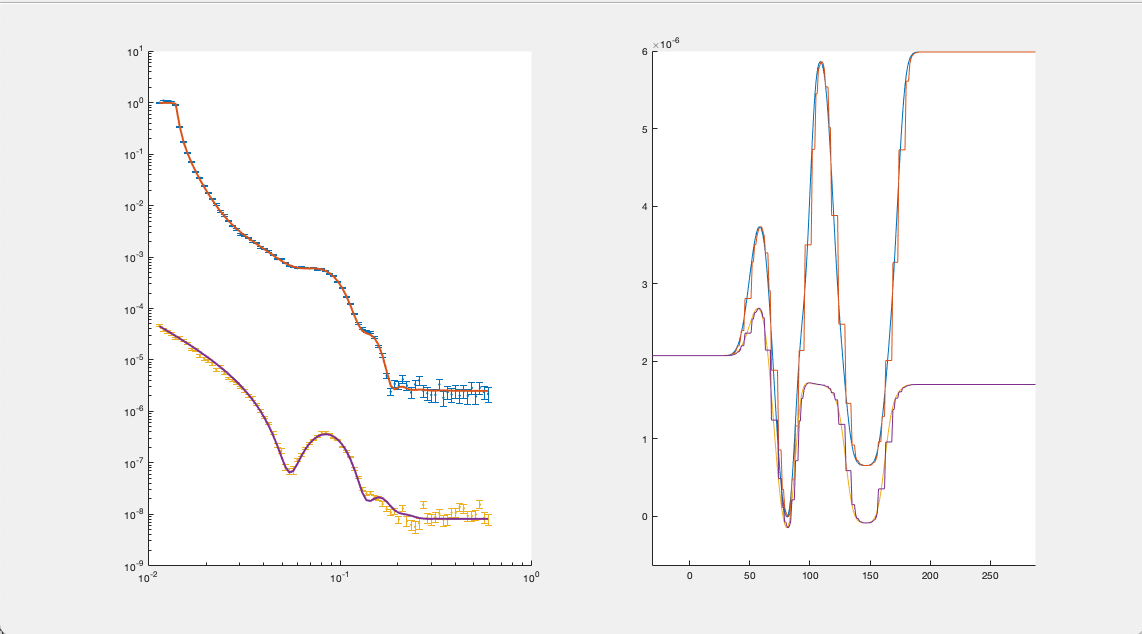
This produces a basic plot of the reflectivity and SLD.
If this plot is not cleared before subsequent plots, then plotRefSLD will overplot allowing the results of calculations to be compared:
controls = controlsClass();
controls.procedure = 'DE';
controls.display = 'final';
controls.parallel = 'contrasts';
[problem, results] = RAT(problem, controls);
plotRefSLD(problem, controls);
controls = RAT.Controls(procedure='DE', display='final', parallel='contrast')
problem, results = RAT.run(problem, controls)
RAT.plotting.plot_ref_sld(problem, controls)
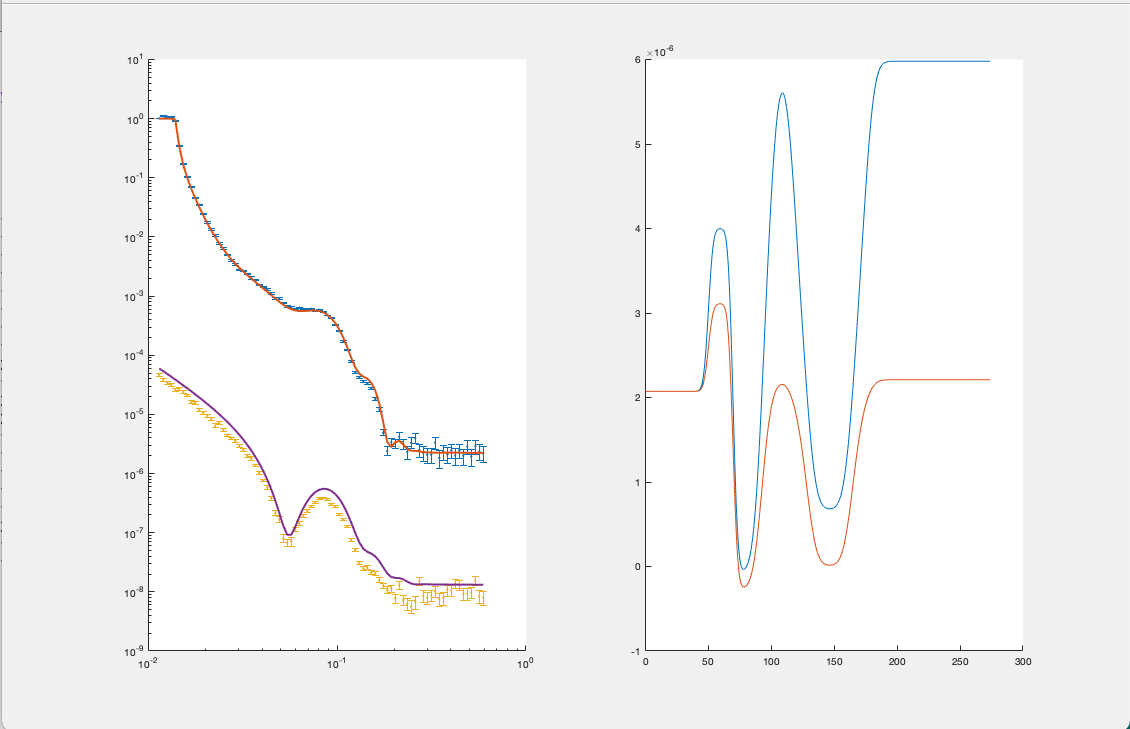
If you don’t wish to overplot, just clear the figure before re-running plotRefSLD.
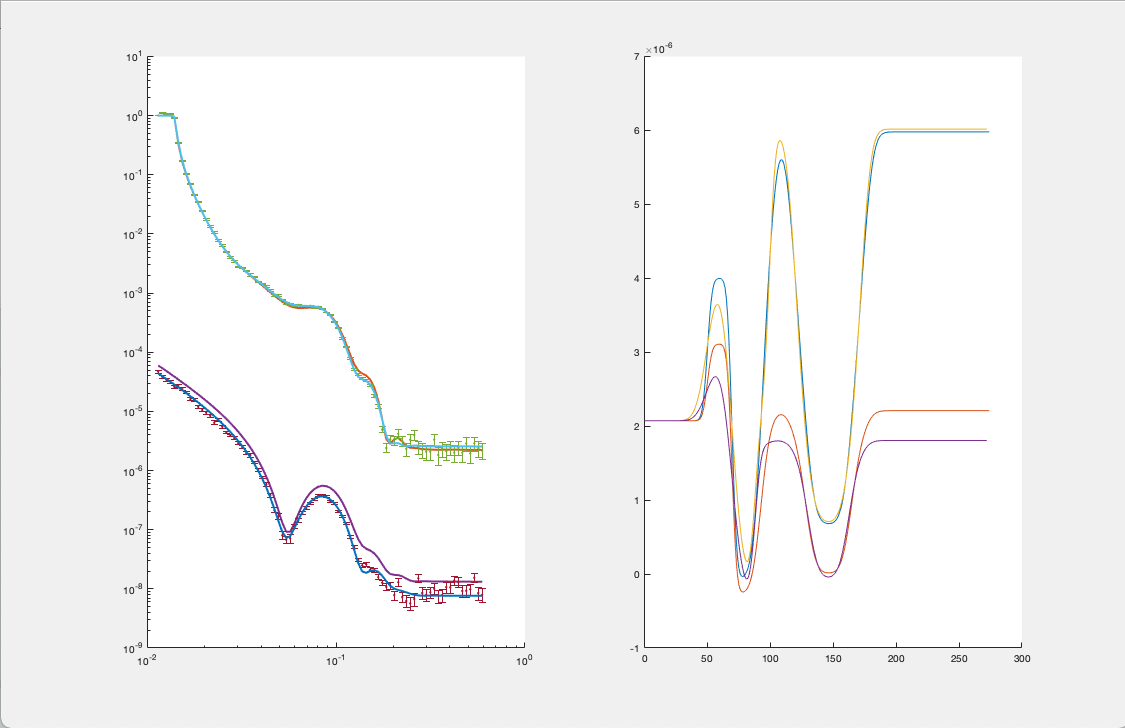
If you are resampling your SLD’s, the plotRefSLD will automatically show the resampled layers for you: