DSPC Custom XY#
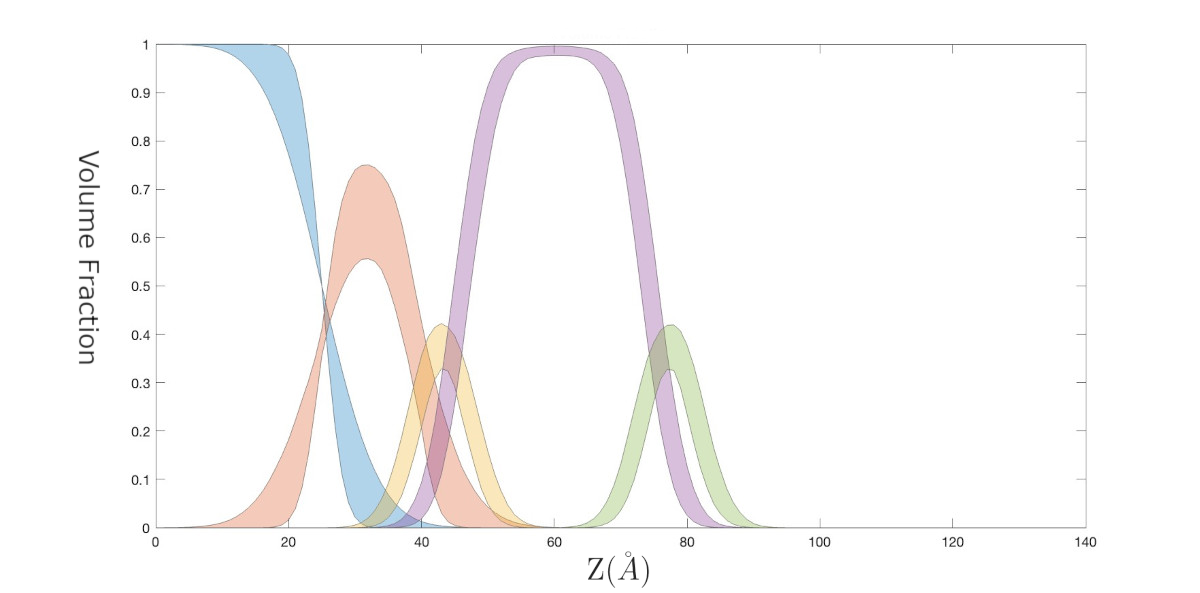
This shows an example of using a custom XY model to analyse reflectivity from a supported bilayer of DSPC.
Similar to DSPC Custom Layers, we can make use of the fact that the volumes, and of course the atomistic composition are known. So, for lipid tails for example, then we can take a literature value for the tails volume, have a fittable parameter for the lipid area per molecule, and then the tail thickness will simply be
Since the volume is known, then the SLD of the tails is also obviously easily calculable.
In this model, we make distributions to represent the volume fractions of each of the components in the sample, the convert these to SLD’s, as described in [1].
We also make our volume fractions as optional outputted parameters from our file. The optional nature of this output means we can suppress it to run the model, then activate it to make final output plots of our analysis.

This example can be run as a script or interactively using the instructions below.
Note
The custom model used is a MATLAB model - examples/normalReflectivity/customXY/customXYDSPC.m.
Run Script:
root = getappdata(0, 'root');
cd(fullfile(root, 'examples', 'normalReflectivity', 'customXY'));
customXYDSPCScript
Run Interactively:
root = getappdata(0, 'root');
cd(fullfile(root, 'examples', 'normalReflectivity', 'customXY'));
edit customXYDSPCSheet
Note
The custom model used is a Python model - RATapi.examples.normal_reflectivity.custom_XY_DSPC.py.
Run Script:
python RATapi.examples.normal_reflectivity.DSPC_custom_XY.py
Run as Function:
import RATapi as RAT
problem, results = RAT.examples.normal_reflectivity.DSPC_custom_XY()
Run Interactively:
jupyter notebook RATapi.examples.normal_reflectivity.DSPC_custom_XY.ipynb
[1] Sheker et al, J. Appl. Phys, 100, 102216 (2011) [DOI 10.1063/1.3661986]
