Basic Plotting#
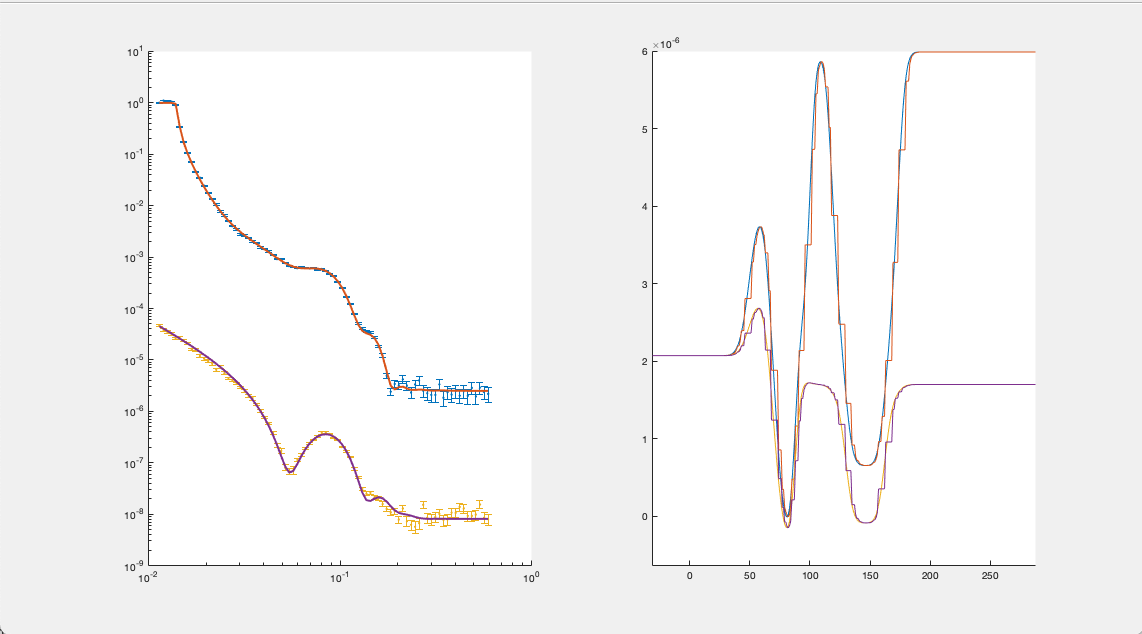
The simplest plot available is a simple display of the contents of the problem and results blocks. The initial problem and result used in this section were made by running DSPC Standard Layers, after running the example a basic plot takes the following form:
figure(1); clf;
plotRefSLD(problem, results)
RAT.plotting.plot_ref_sld(problem, results)
This produces a basic plot of the reflectivity and SLD.
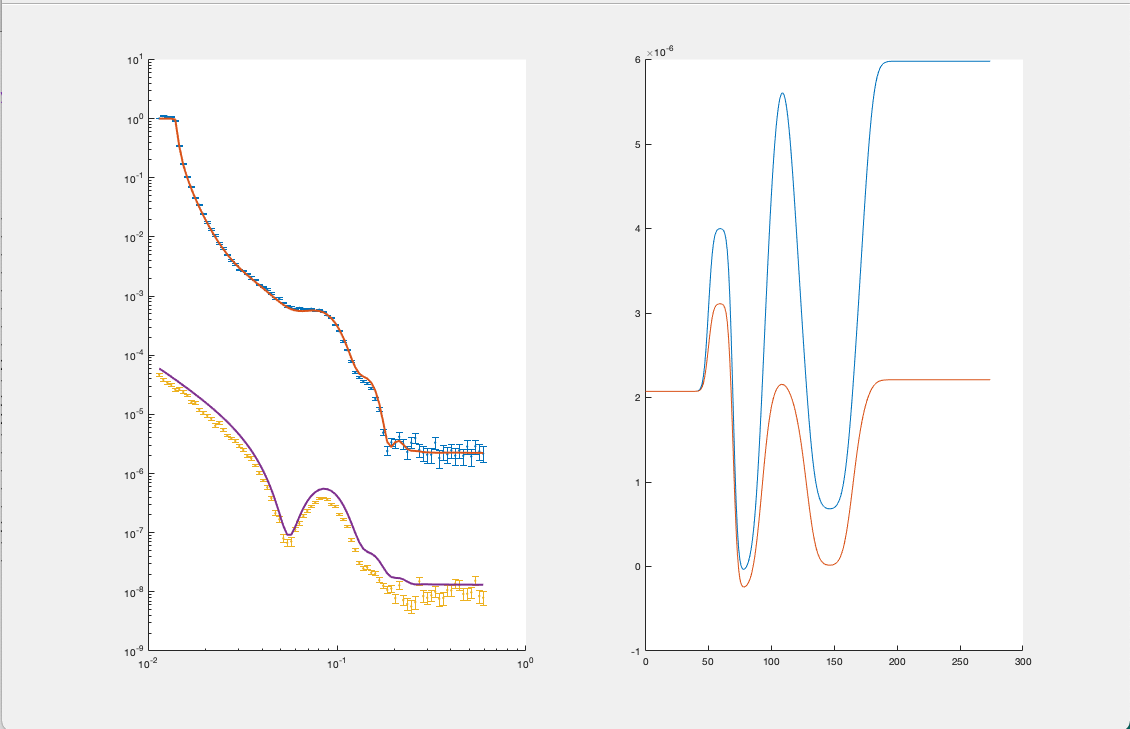
If this plot is not cleared before subsequent plots, then plotRefSLD will overplot allowing the results of calculations to be compared:
controls = controlsClass();
controls.procedure = 'DE';
controls.display = 'final';
controls.parallel = 'contrasts';
[problem, results] = RAT(problem, controls);
plotRefSLD(problem, controls);
controls = RAT.Controls(procedure='DE', display='final', parallel='contrasts')
problem, results = RAT.run(problem, controls)
RAT.plotting.plot_ref_sld(problem, controls)
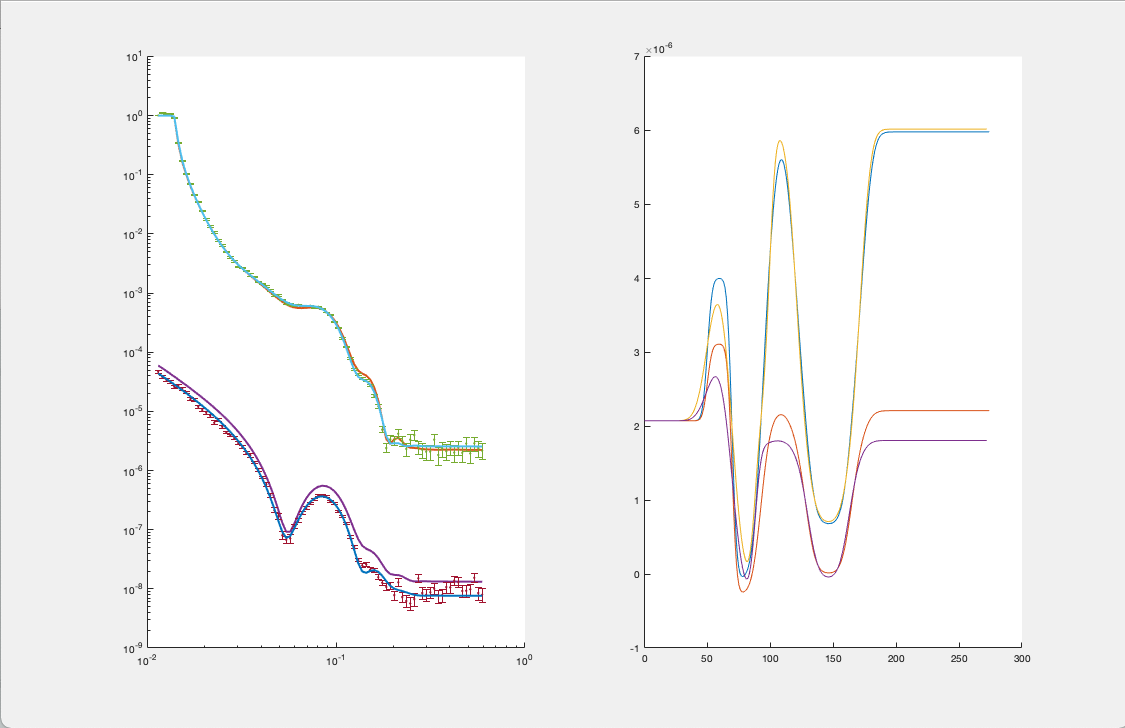
If you don’t wish to overplot, just clear the figure before re-running plotRefSLD.
If you are resampling your SLD’s, the plotRefSLD will automatically show the resampled layers for you: